The correlation coefficient, r, measures the strength of a linear relationship between variables, but not its significance. The null hypothesis of zero correlation between variables, r = 0, can be refuted by a statistical test where the associated p-value is a function both of the magnitude of correlation as well as the sample size. In general, larger sample sizes with larger |r| values are more significant. But how often do p-values and sample size simultaneously increase?
A client’s question of how frequently p-values can increase with increasing sample size is an empirical one best answered by simulation. Pearson correlations from client data ranged from -0.9 to -0.5 and also from 0.3 to 0.9. Increments of 0.01, subdividing these ranges, were considered for 25 different sample sizes ranging from 17 to 41. The variation in sample size simulated the range of unique player counts for a golfing platform over a seven-month period, whereas the ranges in correlation simulated how closely each player’s drill performance translated to tournament success.
Pairs of time series were generated for each correlation value in the aforementioned ranges and were the inputs to cor.test, a significance test for correlations from the R programming language. The results were graphed as a series of boxplots, with one boxplot per sample. Boxplots first appear below in a figure entitled Distribution of P-Value by Sample Size.
Figures and Commentary
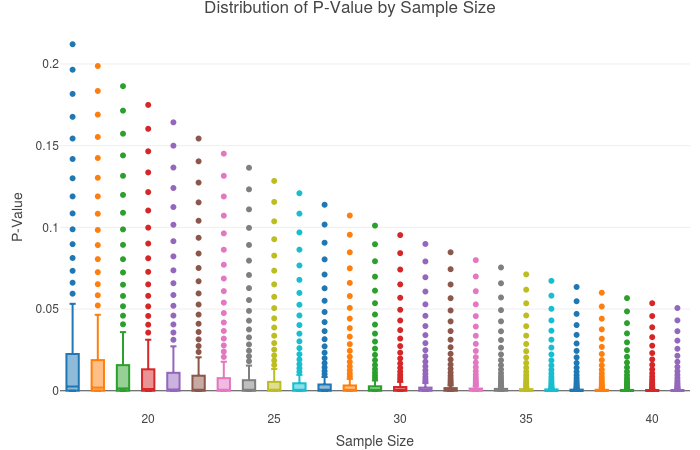 Fig. 1: For each p-value, two series of data points were randomly generated with the designated correlation value. Each sample size had its p-value computed over the range of correlations outlined in the introduction. For example, the following function would generate two random vectors of length 37 and of correlation of 0.77:
random_series = mvrnorm(37, mu = c(0,0), Sigma = matrix(c(1,0.77,0.77,1), ncol = 2), empirical = TRUE)
The cor.test function, performed with both columns of the random_series data structure as its arguments, resulted in a significant correlation t(35) = 7.3023, p « 0.01.
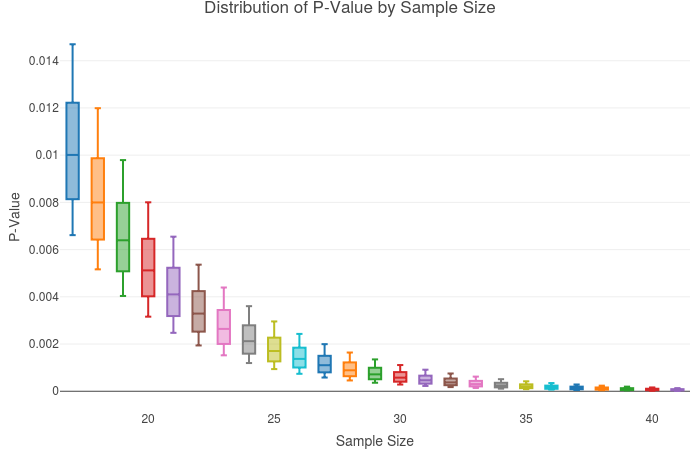 Fig. 2: This time, correlations were restricted to the narrow range of 0.55 to 0.60. The resulting trend is similar to that of Fig. 1 but the range of p-values per sample is compressed. Note the heavy overlap between boxplot ranges. As in Fig. 1, simultaneous increase in both sample size and p-value is a frequent occurrence.
Conclusion
Because correlations are by definition symmetric in range about zero, the p-value can be expressed as twice the probability, P(T > t). Lower-case t is a monotonic-increasing function of correlation as well as sample size. The null distribution becomes approximately standard normal for increasing values of sample size. Shrinking standard deviation coupled with increasing magnitude of t-values crush the value of the symmetric integral defined by P(|T| > |t|). Nevertheless, both figures 1 and 2 show by the overlap of boxplot ranges that the counterintuitive result of simultaneous increase of p-value and sample size is a frequent one. The simulation outlined in this paper was consistent with the phenomena observed in client data.
Packages Used
Carson Sievert, Chris Parmer, Toby Hocking, Scott Chamberlain, Karthik Ram, Marianne Corvellec and Pedro Despouy (2017). plotly: Create Interactive Web Graphics via ‘plotly.js’. R package version 4.7.1. https://CRAN.R-project.org/package=plotly
Garrett Grolemund, Hadley Wickham (2011). Dates and Times Made Easy with lubridate. Journal of Statistical Software, 40(3), 1-25. URL http://www.jstatsoft.org/v40/i03/.
Venables, W. N. & Ripley, B. D. (2002) Modern Applied Statistics with S. Fourth Edition. Springer, New York. ISBN 0-387-95457-0