Whenever past performance is indicative of future results, predictive modeling is prescient. Such is the case with electrical bills. Twenty-two months worth of electrical bills for a four bedroom, two bath apartment of a 1500 square foot duplex in the Lincoln, Nebraska area were submitted by residents. The following billing-period statistics were abstracted from each electrical bill:
- kWh, total kilowatt hour usage,
- avg_kWh_per_day, average kilowatt hour usage per day,
- avg_high, average high temperature, and
- avg_low, average low temperature.
To this raw data, the following columns were added:
- occupant_count, reflecting variations in the number of occupants over the year,
- avg_kWh_day_occupant, average kilowatt hour usage per day per occupant,
- thermostat_max, the average monthly thermostat setting, most relevant in the hotter months,
- high_excess, the extent to which average highs exceeded the max thermostat setting,
- temp_range, the average-high to average-low temperature range,
- high_excessXtemp_range, the product of high excess and temperature range as an interaction variable,
- low_excess, the maximum of zero and the extent to which average lows exceeded maximum thermostat settings, a negative number in the colder months,
- daylight_hrs, the number of daylight hours, normalized to the 15th of each month from 2018 regardless of year, as this value is relatively stable on an annual basis, and
- day_lightXlow, the product of daylight and low temperatures as an interaction variable.
A multivariate linear regression of avg_kwh_day_occupant was performed on the following predictors, defined above:
- high_excess
- high_excessXtemp_range
- daylight_hrs
- occupant_count
- thermostat_max
- low_excess
- temp_range
The outcome of this regression is depicted in Fig. 1 below, with the predicted value scaled by the number of occupants.
Figures and Commentary
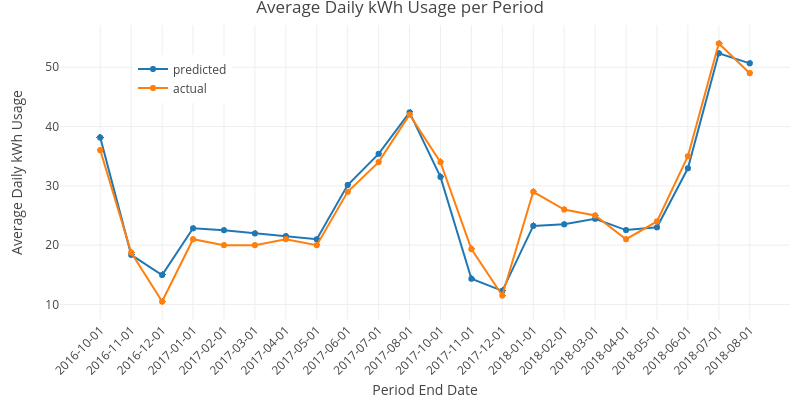 Fig. 1: A multivariate regression analysis of average daily kilowatt-hour usage on multiple predictors. This regression noticeably over-predicted the months of December through May for 2017 and underpredicted the same for 2018. The systematic, seasonal discrepancies suggested that the hot months and cold months required separate treatment, and the months were divided into two categories based on whether their average daily highs exceeded the thermostat setting. Since heating was gas powered whereas cooling was electric, electrical usage in cold months was significantly more difficult to predict.
In the case of multiple linear regression, none of the individual model components were statistically significant at the 5% level, and only the high_excess variable was significant at the 10% level. Together, all of the predictors were explanatory for the multiple linear regression model F(8,13) = 8.742, p = .0003831 whereas none were predictive by themselves. Although high multicolinearity was observed among some of the predictors, this was not concerning as the aim of this paper was to predict electrical usage as opposed to quantifying the individual effects of the predictors.
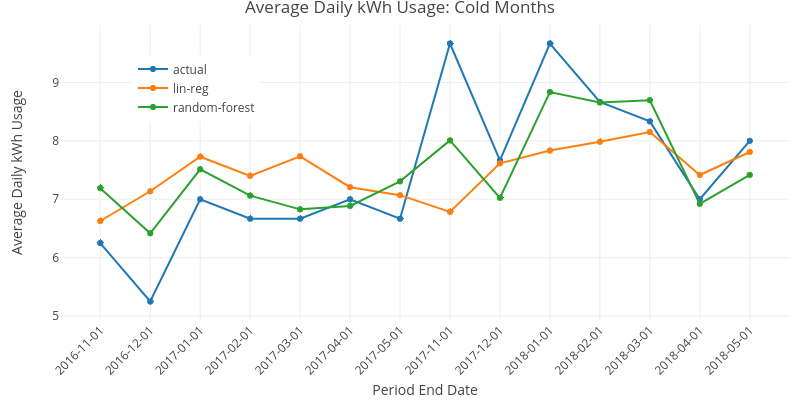 Fig. 2: Hot months were defined as those where the average monthly temperature exceeded the thermostat setting of either 72 or 75 degrees, depending on occupant preference. As the hot months of June through October were well modeled relative to the cold months of September through November, the cold months were considered separately. Because the air conditioner was not run during cold months, a different set of predictors was used: avg_high, avg_low, and day_lightXlow.
Random forests regression significantly outperformed multiple linear regression over the cold months; the random-forest models matched both trend concavity and actual values much more closely. Random forests will be integrated into the modeling for the next figure.
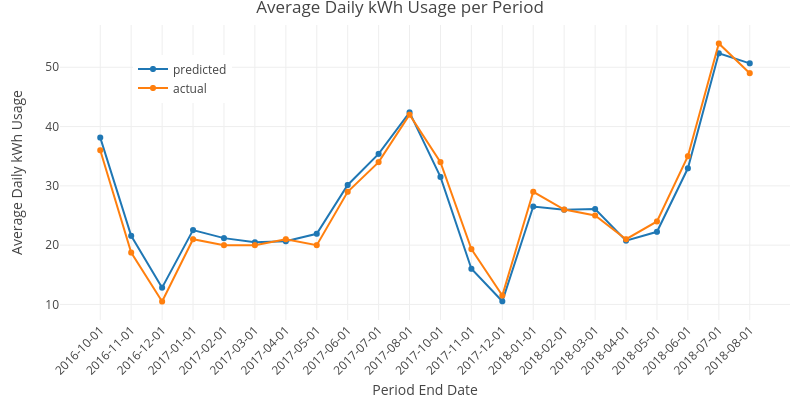 Fig. 3: Hot months were modeled as before using multiple linear regression. Cold months were modeled using random forests on the predictors mentioned in Fig. 2. The overall root mean square error (RMSE) dropped from approximately 2.41 for the multiple linear regression all the way to approximately 1.74 for the hot-month multi-linear cold-month random-forest integrated model. This represents an almost 28% reduction in model error.
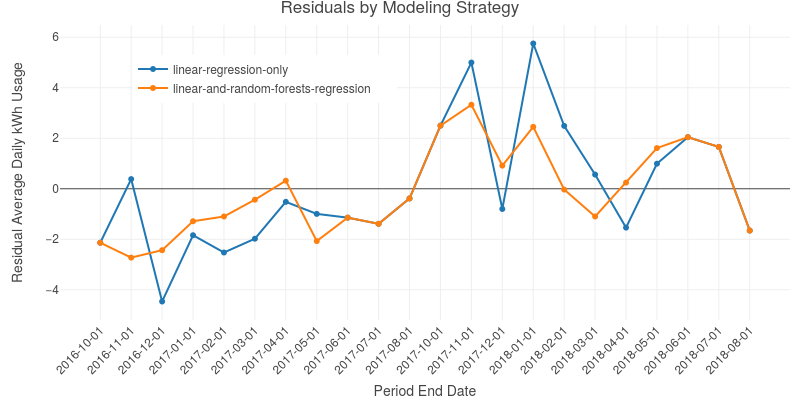 Fig. 4: The residuals for both the multiple linear and the regression model appear above. The regions with perfect overlap occur because for both models, the same multiple linear regression method was used. The cold months show the outperformance of the random forest method over its multiple linear counterpart, whereas multiple linear regression outperforms random forests in the hotter months. A perfect model fit would have all of its residuals be identically zero. The closer a model’s residuals are to zero, the better the model’s fit.
Conclusion
Random forests and multiple linear regression can outperform each other depending on the linearity of the underlying phenomenon (Čeh 2018). In our case, the relationship between the summer months was highly linear whereas the relationship between the winter months was relatively nonlinear. Unsurprisingly, the optimized random-forest multiple-linear regression model outperformed the solo performance of either regression paradigm.
The average residential and commercial electrical bills are \$139.98 and \$40,614 per month in the United States (LES 2018). Accurate predictive modeling of electrical usage could allow companies to operate with smaller margins, and thereby pass these savings on to the consumer. Budget billing plans could also be more accurately priced, preventing electrical companies or consumers from either overpaying or underpaying, eliminating interest-free loans between the parties.
Modern life guarantees death, taxes, and electrical bills. However, modern life would remain silent on the quantities assigned to these guarantees if not for actuaries, accountants, and predictive modelers. These occupational categories are not mutually exclusive. Might predictive modeling benefit the cash flow of your business?
Works Cited
Čeh, Marjan, et al. “Estimating the Performance of Random Forest versus Multiple Regression for Predicting Prices of the Apartments.” ISPRS International Journal of Geo-Information, vol. 7, no. 5, Feb. 2018, p. 168., doi:10.3390/ijgi7050168.
“Current | LES Customer Newsletter Current - August 2018.” Resource Library, Lincoln Electric System, 1 Aug. 2018.
Lincoln, Nebraska, USA - Sunrise, Sunset, and Daylength, August 2018. (n.d.). Retrieved from https://www.timeanddate.com/sun/usa/lincoln
Packages Used
Carson Sievers, Chris Parmer, Toby Hocking, Scott Chamberlain, Karthik Ram, Marianne Corvellec and Pedro Despouy (2017). plotly: Create Interactive Web Graphics via ‘plotly.js’. R package version 4.7.1. https://CRAN.R-project.org/package=plotly https://CRAN.R-project.org/package=dplyr Hadley Wickham, Romain Francois, Lionel Henry and Kirill Müller (2017). dplyr: A Grammar of Data Manipulation. R package version 0.7.4.
Max Kuhn. Contributions from Jed Wing, Steve Weston, Andre Williams, Chris Keefer, Allan Engelhardt, Tony Cooper, Zachary Mayer, Brenton Kenkel, the R Core Team, Michael Benesty, Reynald Lescarbeau, Andrew Ziem, Luca Scrucca, Yuan Tang, Can Candan and Tyler Hunt. (2017). caret: Classification and Regression Training. R package version 6.0-78. https://CRAN.R-project.org/package=caret