In this post, we consider the annualized cost of hiring a data scientist as an employee, and offer our services on a contract basis as a viable alternative.
Problem
The hidden costs of hiring begin long before an offer is made and continue long after. Newly-posted jobs require an average of 42 days to fill. (1) Professional onboarding costs include the inevitable orientation period during which new hires earn full salary but have yet to attain full productivity. From the first paycheck, payroll taxes and unemployment insurance deductions take their toll. Year-over-year percentage increases in health insurance premia are often in the double digits. (2) At the time of this writing, data scientist salaries average a stratospheric \$113,436 with annual increases of up to 16% in recent years. (3)
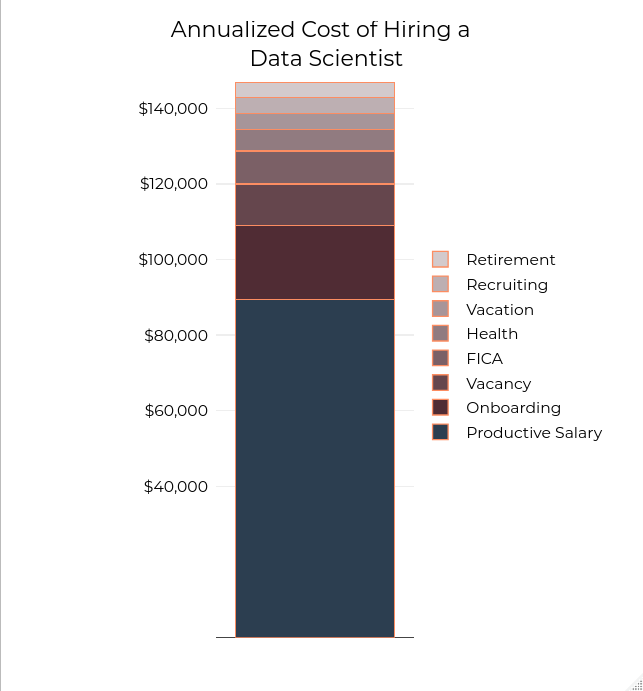
The hiring of employees comes with the implicit obligation to keep them busy, the constant risk of turnover, and the necessity of doubling or tripling the value that they are paid per billable hour when invoicing the relevant client. For this reason, job creation may be one of the costliest and therefore one of the riskiest endeavors in America. Nevertheless, many small businesses could benefit from data-driven insights but could do without the costs associated with hiring a data scientist. These costs are depicted in the following figure:
Fig. 1: The correspondence between the following graph components and their respective sources is as follows: Vacancy (1), Vacation (1), Health (4), Recruiting (5), Onboarding (6), Retirement (7), FICA (8), and Salary (9). State and federal unemployment insurance (SUTA/FUTA) as well as workers’ compensation were excluded as they are variable, industry-specific, and even employer-specific expenses. A breakdown of costs immediately follows.
Cost Breakdown
- Vacancy: \$10,907
- Vacation: \$4,363
- Health: \$5,655
- Recruiting:\$4,119
- Onboarding: \$19,633
- Retirement (401k match): \$3,970
- FICA: \$8,678
- Productive Salary: \$113,436 - \$19,633 - \$4,363 = \$89,440 (decremented by onboarding costs, vacation)
Methodology
Employee productivity ramps up slowly after hiring, with 25% productivity during weeks 1-4, 50% productivity during weeks 5-12, 75% during weeks 13-20, and eventually full productivity. (6) These figures imply that in the first year of a new employee’s tenure, 11 weeks’ salary is devoted to unproductive labor. Professional onboarding costs and two weeks’ vacation were subtracted from gross salary to yield the “productive salary.” In other words, \$113,436 must be paid to receive only \$89,440 worth of work.
FICA, retirement, professional onboarding, paid vacation/sick days, and vacancy were all computed as fractions of salary. Recruiting, vacancy and health insurance were flat dollar figures. All figures represent the averages indicated by their respective sources.
Solution
Instead of hiring a data scientist, contracting the role out can be an attractive alternative:
- Talent Pool: Instead of hiring one person with one background, you hire a team with diverse skills.
- Enhanced Focus: Contracting allows you to focus on what you do best.
- Reduced Cost: You don’t have to hire an employee and incur these additional costs.
Works Cited
(1) “8 Recruiting Metrics You Should Be Tracking in 2019.” HireVue, https://www.hirevue.com/blog/seven-recruitment-metrics-that-matter.
(2) Cauchi, Dick, and Alise Garcia. “Health Insurance: Premiums and Increases.” Health Insurance: Premiums and Increases, National Conference of State Legislatures, 4 Dec. 2018, https://www.ncsl.org/research/health/health-insurance-premiums.aspx.
(3) “The Age of Analytics: Competing in a Data-Driven World.” McKinsey & Company, McKinsey Global Institute, Dec. 2016, https://www.mckinsey.com/~/media/McKinsey/Business%20Functions/McKinsey%20Analytics/Our%20Insights/The%20age%20of%20analytics%20Competing%20in%20a%20data%20driven%20world/MGI-The-Age-of-Analytics-Full-report.ashx.
(4) Merhar, Christina. “What Percent of Health Insurance Is Paid by Employers?” PeopleKeep, https://www.peoplekeep.com/blog/what-percent-of-health-insurance-is-paid-by-employers.
(5) Shrm. “Average Cost-per-Hire for Companies Is $4,129, SHRM Survey Finds.” SHRM, SHRM, 19 May 2017, https://www.shrm.org/about-shrm/press-room/press-releases/pages/human-capital-benchmarking-report.aspx.
(6) Mueller, Annie. “The Cost Of Hiring A New Employee.” Investopedia, Investopedia, 25 June 2019, https://www.investopedia.com/financial-edge/0711/the-cost-of-hiring-a-new-employee.aspx.
(7) “Average 401K Match: UpCounsel 2019.” UpCounsel, https://www.upcounsel.com/average-401k-match
(8) Employers’ Responsibility for FICA Payroll Taxes.” Bizfilings, https://www.bizfilings.com/toolkit/research-topics/managing-your-taxes/payroll-taxes/employers-responsibility-for-fica-payroll-taxes.
(9) “How Much Is a Data Scientist’s Salary?: University of Wisconsin.” University of Wisconsin Data Science Degree, https://datasciencedegree.wisconsin.edu/data-science/data-scientist-salary/
Packages Used
Carson Sievert (2018) plotly for R. https://plotly-r.com
